earned value

Article - Your Ultimate Guide to Earned Value Management


learning-platform_0.jpg

In my previous article “How to Explain Earned Value to Dummies” I touched upon the subject of Earned Value and how to explain it in a simple way. The post since went viral on LinkedIn generating several thousand hits. One of my followers expressed her desire to see someone (i.e. yours truly) describe the entire domain of EVM in a similar fashion. So, here you go!

Inputs:

  • You have to dig a trench by extracting 1,000 cubic meters of sand.
  • The duration of the project is 10 days (assume no initiation, planning or close-out stages, only execution)
  • Your budget is $5,000
  • You therefore believe that you should be digging 100m3/day and spending $500/day in order to finish this project on-time and on-budget.

As a result of these assumptions, you do the following (see Table 1):

  • Populate the “Scheduled Work” row with ten “100 m3/day figures
  • Populate the “Cumulative Work” row with incrementally increasing corresponding numbers (i.e. 100 m3/day, 200 m3/day, 300 m3/day, etc.)
  • Populate the “Budget” row with $500/day figures
  • Populate the “Cumulative Budget” row with incrementally increasing corresponding numbers (i.e. $500/day, $1,000/day, $1,500/day, etc.)
  • Finally, the “Planned Progress” numbers are equal to the “Cumulative Work” for that particular day divided by total work planned (i.e. 1,000 m3).

Table 1

EVM Explanation.JPG

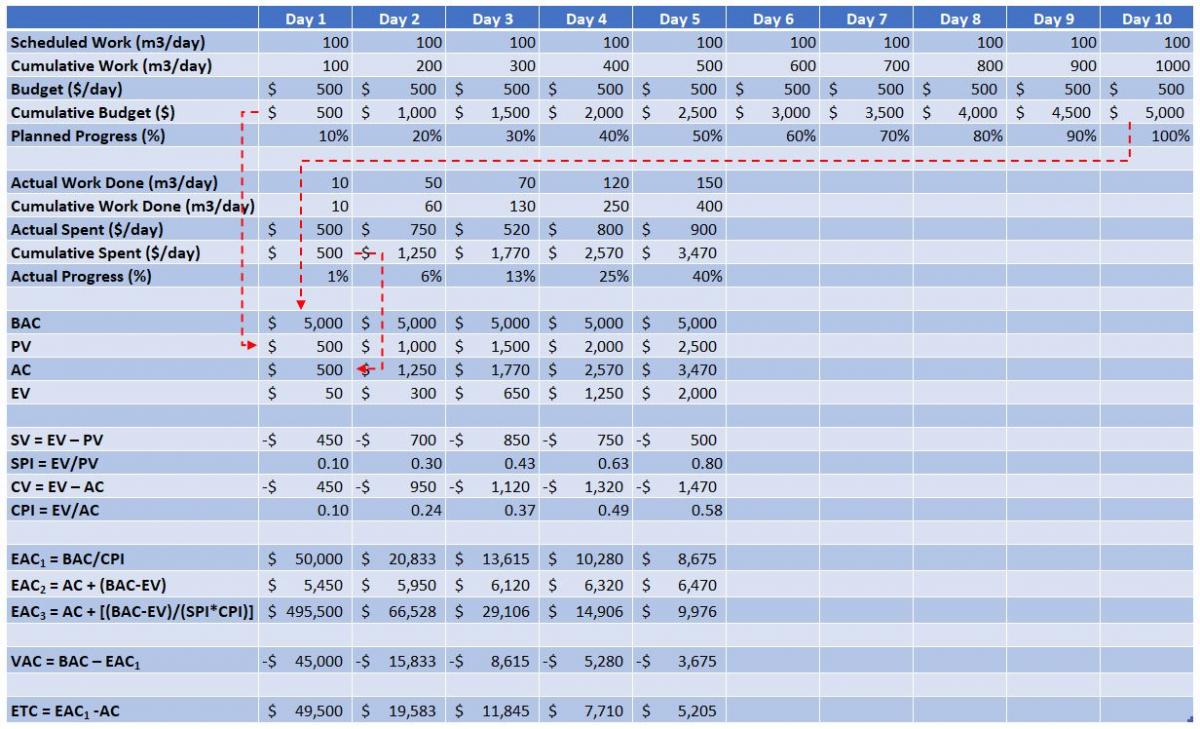
Now imagine that we are at the end of Day 5. Let us pretend that you extracted 10, 50, 70, 120 and 150 m3 on days 1-5 respectively, instead of a planned pace of 100m3/day (see “Actual Work Done” and “Cumulative Work Done” rows)

Imagine also that you also spent $500, $750, $520, $800 and $900 days 1-5 respectively, instead of a planned pace of 500$/day (see “Actual Spent” and “Cumulative Spent” rows).

Article - How to Explain Earned Value to Dummies


learning-platform_0.jpg


In the course of my career I have encountered on numerous occasions a situation where executives, top managers and even project managers had issues with understanding the concept of Earned Value. So, I have developed a series of very simple examples to address that issue.

Imagine the following:

You have ten days to produce ten glasses at a total cost of $10. You project does not have Initiation, Planning or Close-out stages; only Execution and Monitoring. Having said that, it is reasonable to assume that you should be producing 1 glass a day and spending $1 per glass.

1 glass per day @ $1/glass

The key EV formulas are:

PV = Planned Quantity X Planned Cost

AC = Actual Quantity X Actual Cost

EV = Actual Quantity X Planned Cost

Schedule Variance = SV = EV – PV

Where:

  • SV = $0 means we are on plan in terms of spending (neutral)
  • SV > $0 means we are ahead of plan in terms of spending (good)
  • SV < $0 means we are behind plan in terms of spending (bad)

Cost Variance = CV = EV – AC

Where:

  • CV = $0 means we spent the same amount as the value of the work we received (neutral)
  • CV > $0 means we spent a lesser amount than the value of the work we received (good)
  • CV < $0 means we spent a greater amount than the value of the work we received (bad)

NOTE: Don’t worry if the formulas don’t make sense at this point of time, they will become clear very soon!

Let us examine several potential situations:

Day 7

7 glasses @ $2/glass

It is day 7 and you have produced 7 glasses at a cost of $14. Where do you think (without going into formulas) you are in terms of budget and time? It is day 7 and you have manufactured 7 glasses, so you are on time. However, you have exceeded your budget of $1/glass.

Let us examine the following situation using our formulas: