
The next company to be discussed in our ongoing project portfolio management series is a rail transport engineering company that has encountered several challenges in the past several years. The organization has been reporting heavy losses from its operations for the past decade with no sign of potential improvement.
The analysis of the company's operations has shown that one of the main reasons for the poor performance of the company was the large number of products produced by the organization as a result of various customization requests from their customers.
This in its turn led to a very large number of concurrent projects with a lion's share of them being customization rather than new product development ventures. As a result the quality of the project products has also declined leading to major delays in the product delivery to the customers.
Strategy
As a result of the above-mentioned events the executives of the company came up with the following strategy:
- Implement rigorous project portfolio management system in order to (a) prioritize projects and (b) cut low-priority ventures
- Create platform products in order decrease the degree of customization and to eliminate complexity
- Increase sales and margins per product category
- Expand the markets to China, Africa, South America
- Improve customer care
- Improve product quality
The Scoring Model
The scoring model developed as a result of the project portfolio management initiative has consisted of the six variables (see also Table 1):
- Market attractiveness
- Fit to existing supply chain
- Product and competitive advantage
- Technical feasibility
- Time to break even
- NPV
Table 1
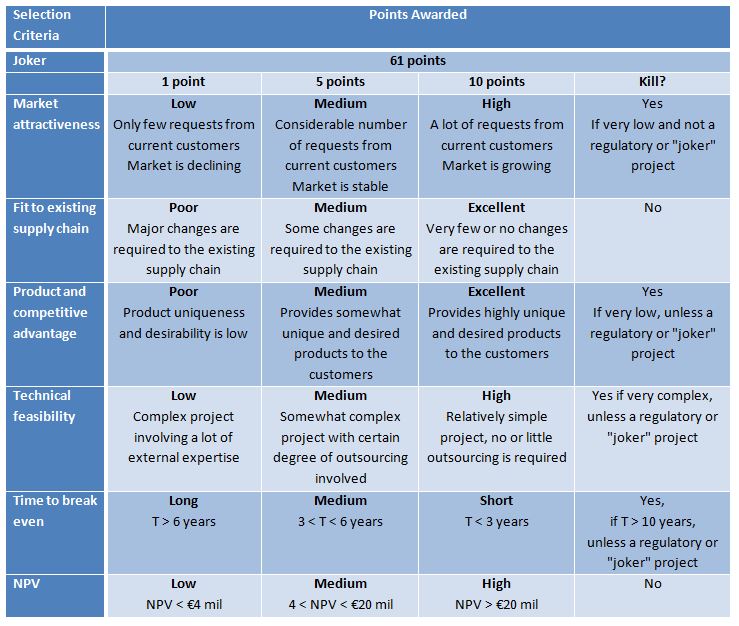
Interestingly enough the company management decided not to include the strategic fit as one of the variables in the model, arguing that the combination of the variables selected would address all of their strategic initiatives in a more efficient way.
As a result the maximum number of points the project could generate was sixty, while the minimum - unless it was added to the kill category - six points.
Portfolio Balance
Company executives decided to monitor the balance of their portfolio via the risk vs. reward graph (see Figure 1):
Figure 3

Strategic Alignment
The management decided to adopt the "top-down, bottom up" approach to the project selection with the following strategic buckets:
- Stay in business projects - 10-20% of total project expenses
- Product improvements - 60-70% of total project expenses
- New product lines - 10-30% of total project expenses
About the Author
Jamal Moustafaev, MBA, PMP – president and founder of Thinktank Consulting is an internationally acclaimed expert and speaker in the areas of project/portfolio management, scope definition, process improvement and corporate training. Jamal Moustafaev has done work for private-sector companies and government organizations in Canada, US, Asia, Europe and Middle East. Read Jamal’s Blog @ www.thinktankconsulting.ca
- Please follow me on Twitter:
- Like our page on Facebook:
- Connect with me on LinkedIn:
- Subscribe to my RSS feed:
Jamal is an author of two very popular books: Delivering Exceptional Project Results: A Practical Guide to Project Selection, Scoping, Estimation and Management and Project Scope Management: A Practical Guide to Requirements for Engineering, Product, Construction, IT and Enterprise Projects.